Anchors Away: Bedrock's Treasure Hunt for Kawika's Sunken Secrets
During our December adventure beneath the waves of the Monterey Bay National Marine Sanctuary (MBNMS), we set our sights on a local legend: a reputed abandoned anchor known to regional divers and maritime enthusiasts alike. Our initial clue to this anchor's existence and rough location came from conversations with local maritime operators. Further investigation revealed not just one, but four anchors lying on the seabed at about 25 meters deep, known collectively as 'Kawika’s Anchor Farm' in honor of local diver Kawika Chetron (more info).
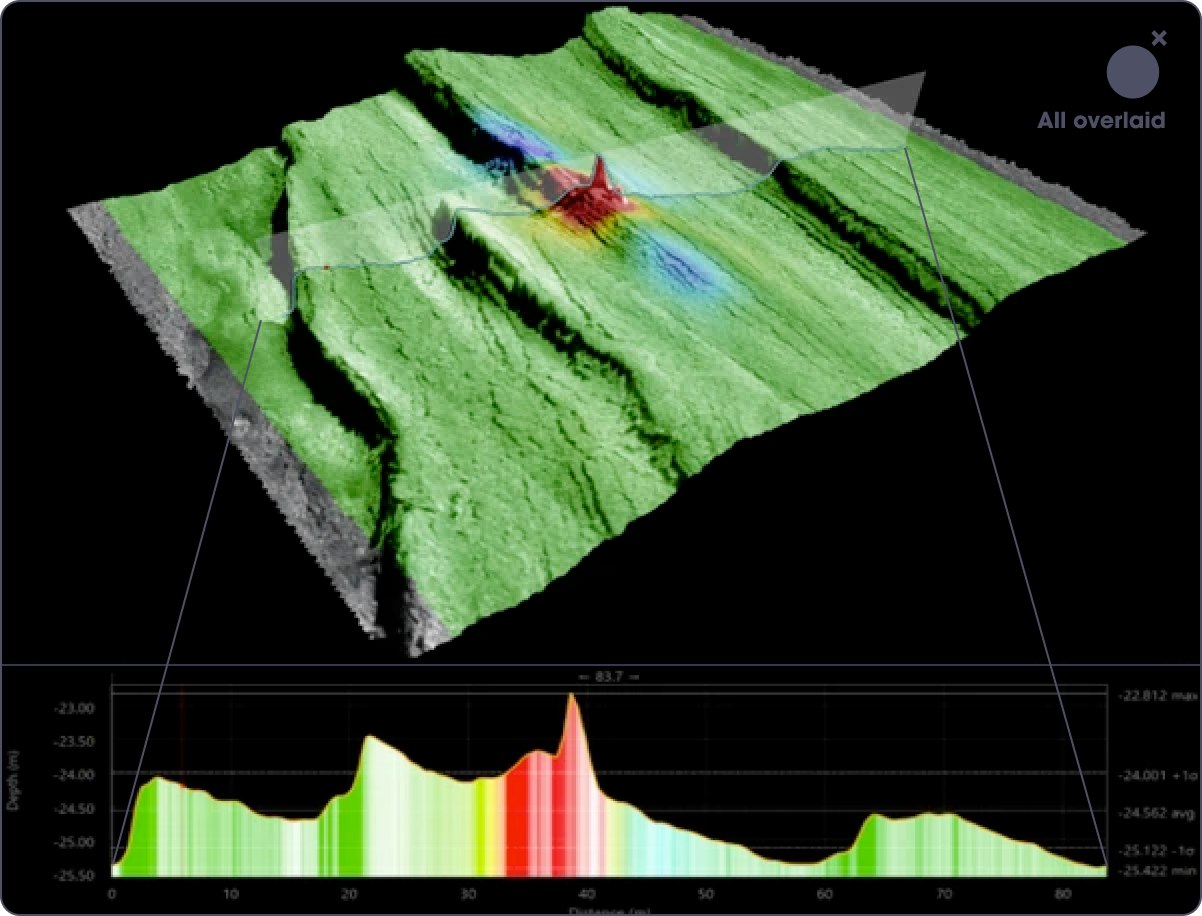
Figure 1. 3D image of survey area (top) with profile extracted over the feature identified at anchor 02 and 03. 3D height is controlled by bathymetry data, shading by side-scan, and color by residual magnetic field.
Our goal for this field test was thorough data collection around a cluster of two anchors in this region, aiming to demonstrate Bedrock's ability to accurately detect and map specific underwater features. The game plan was straightforward: using Bedrock’s custom survey planning tool, plan and map a 100 x 100 m area in a systematic lawnmower pattern, with our AUV cruising at a steady 9 m above the seabed. All told, the test took about 20 minutes to complete, but we could happily stare at the resulting data for hours!
Bedrock nailed the field test goals, pinpointing the abandoned anchor within the MBNMS across every piece of geophysical data we threw at it - from multibeam to side-scan and magnetometer readings. The fact that we spotted the anchor in all these varied datasets really drives home how spot-on our methods are and just how good Bedrock is at uncovering hidden gems on the ocean floor.

Figure 2. Multibeam bathymetry data shown in map view (left) and 3d view (right) both gridded at 0.5m resolution. Depth variations are primarily driven by shale outcropping in this region, and a central contact identified within the data is the bathymetric expression of known abandoned anchors.
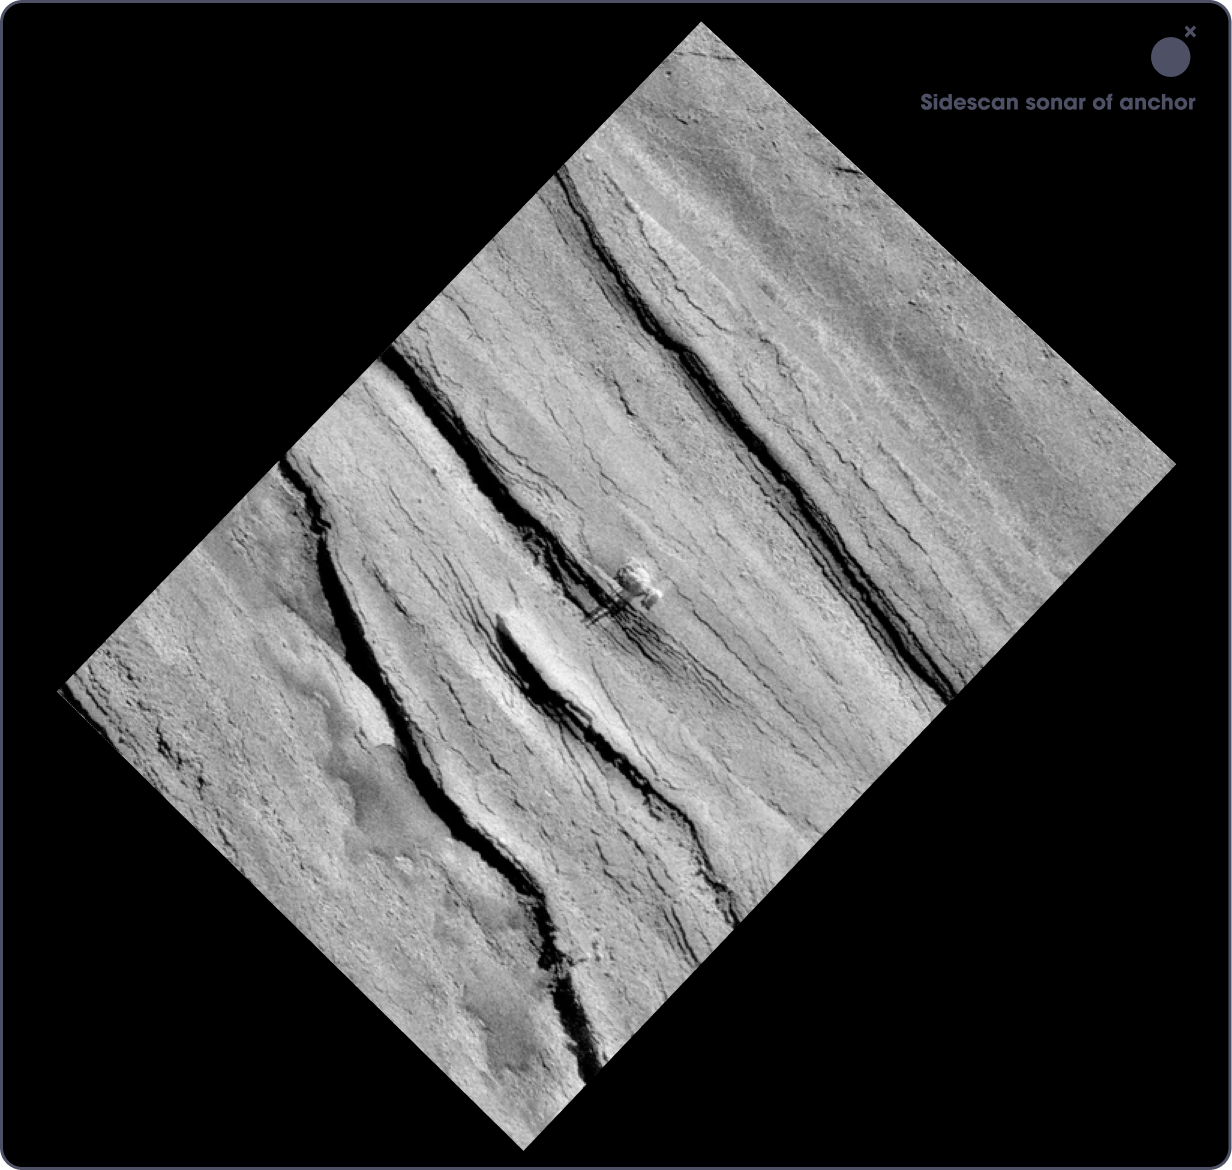
Figure 3. Side-scan sonar data mosaiced at 10cm resolution, with a clear contact at the center of the mosaic associated with the location of the anchors we were mapping.

Figure 4. Magnetic analytic signal data gridded at 0.5m with units in nanotesla, indicating a clear central magnetic anomaly at the center of the mapped region.
While these anchors are apparent across our datasets, they really stood out when we more closely examined our side-scan sonar (SSS) data, showing off three towering structures that stretch more than 2 meters up from the ocean floor. We double-checked these findings by comparing our SSS snapshots with video clips from local divers (Scuba Diving - The Pinnacles and Anchor Farm) . This side-by-side look didn't just back up the unique shapes of the anchors we saw; it also gave us a peek at the vibrant marine life making a home on and around these underwater landmarks. For a closer look at all our datasets from this field test, as well as an in depth report, be sure to check out the full details in Mosaic.
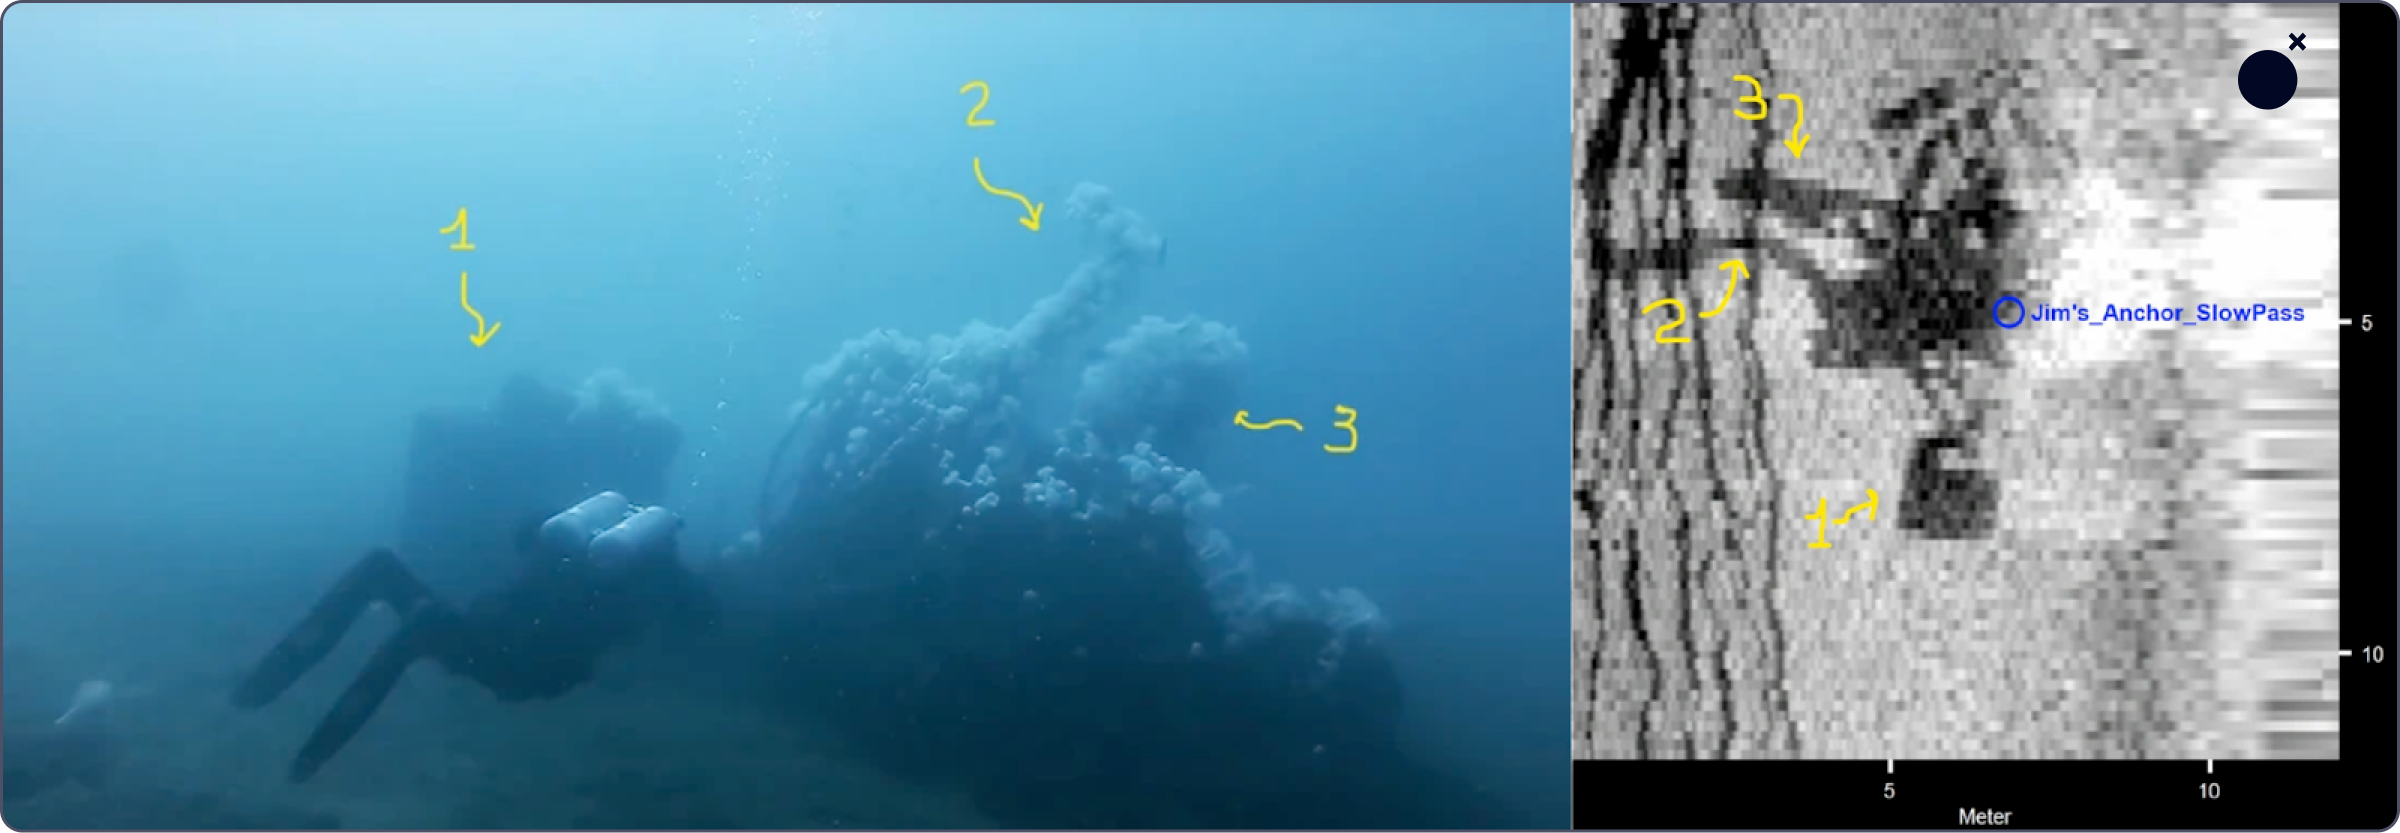
Figure 5. Imagery taken from video collected by local scuba divers (left) as compared to side-scan sonar imagery (right), with interpretation overlain supporting the presence of three distinct anthropogenic structures on the seabed.
Closing out our December expedition in the MBNMS, we were thrilled to not only aim for a piece of underwater history but to successfully map it on our first try. Identifying 'Kawika’s Anchor Farm' so clearly in our data was a standout moment, showcasing the anchors as clear markers on the ocean floor. It’s exciting to see our technology in action, revealing parts of the deep that tell stories of the past. As we continue our journey in 2024, stay tuned to Bedrock. There’s much more to discover, and we’re just getting started in unveiling the ocean's secrets.
Permit #: MBNMS-2022-023-A1